Global Launch January, 2019.
The HBDI® Pair Report has great visual appeal and has new and improved easy to read and understand reports. We’ll take each new page and explain, but these reports are designed to be much more user friendly. Don’t worry you’ve got this!
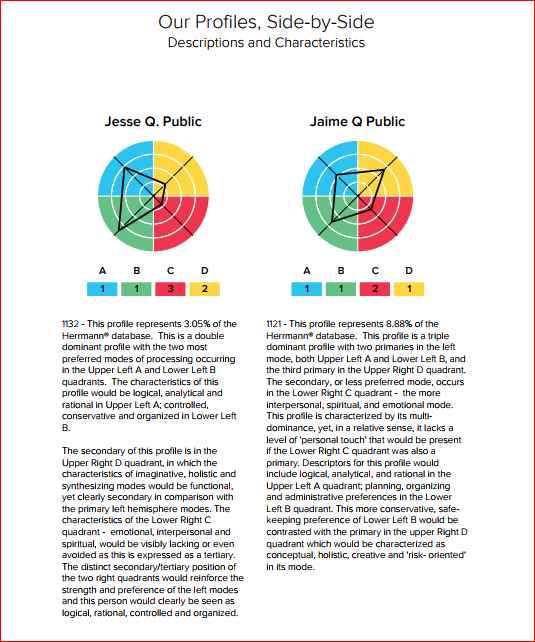
What’s new?Profiles Side-by-Side |
 |
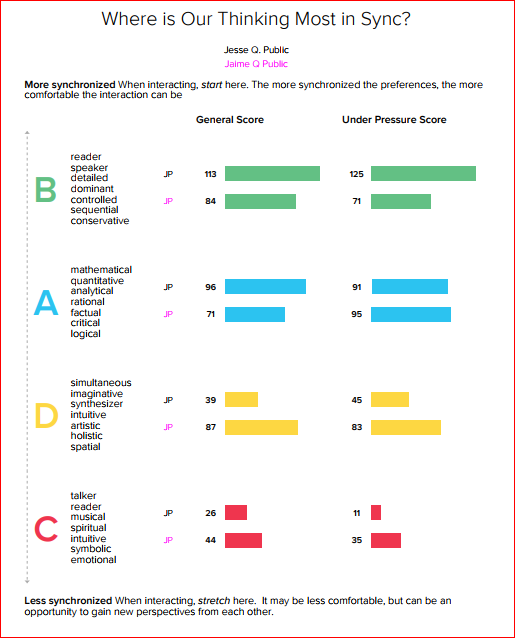 |
Where Is Our Thinking Most in Sync? From the most similar quadrant to the least similar quadrant, the scores for each Thinker are compared both overall, and when “Under Pressure”. |
|
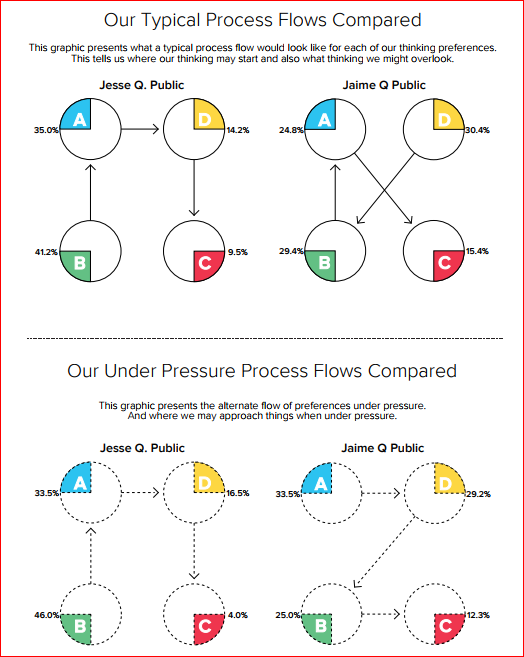
Our Typical Process Flows Compared As a Practitioner you’ll be quite comfortable with this report. It’s based on the same style from the Team Report. This powerful representation allows the two Thinkers to quickly see their “Flow” of thinking generally and when under pressure, and how they may be similar or different. |
 |
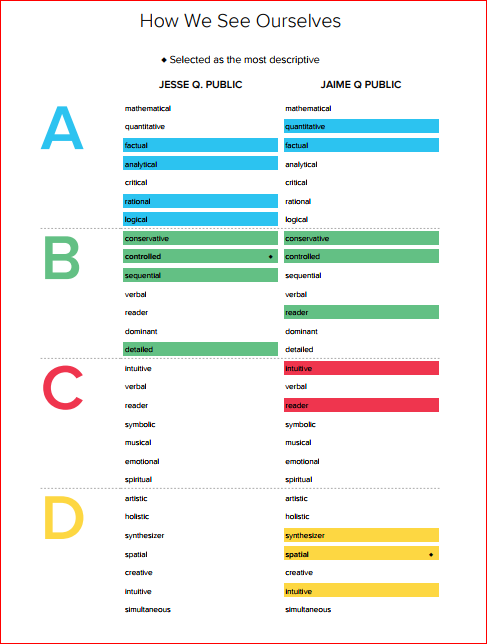 |
How We See Ourselves This new display of the Key Descriptors quickly demonstrates the similarities and differences for the two Thinkers. |
|
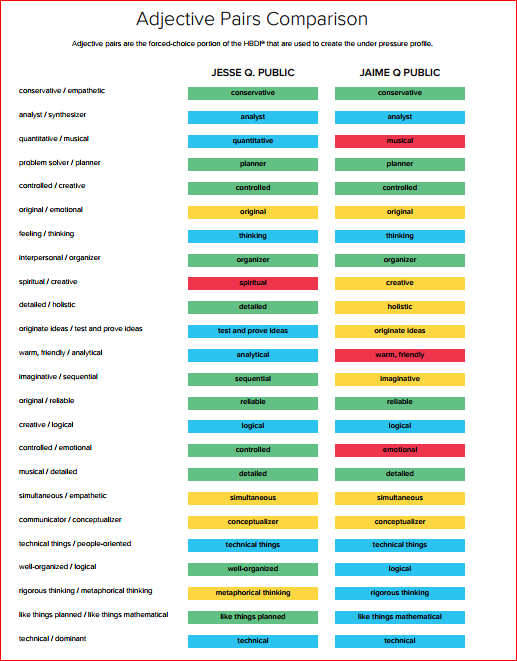
Adjective Pairs Comparison This quick to read report will help facilitate the discussions around where Thinkers “go” when they are forced to make a choice. And the Thinkers will quickly see how they compare and contrast. |
 |
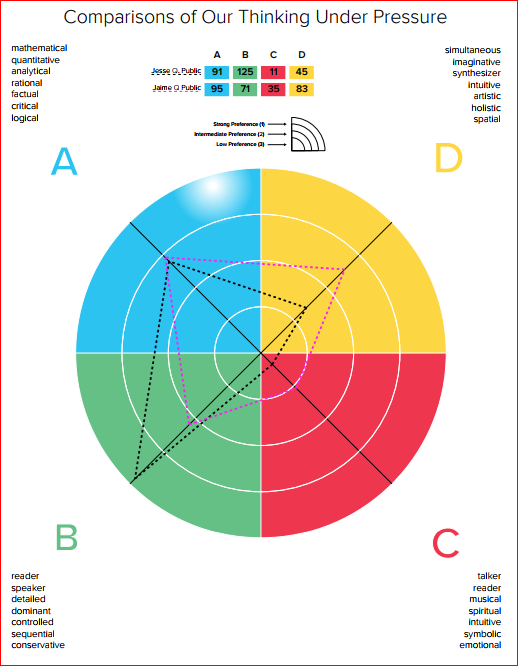 |
Comparisons of Our Thinking Under Pressure Once Thinkers have reviewed their choices in the Adjective Pairs section, they can see quickly how these choices are plotted on the profile to demonstrate the similarities and differences when they are “Under Pressure.” |
|
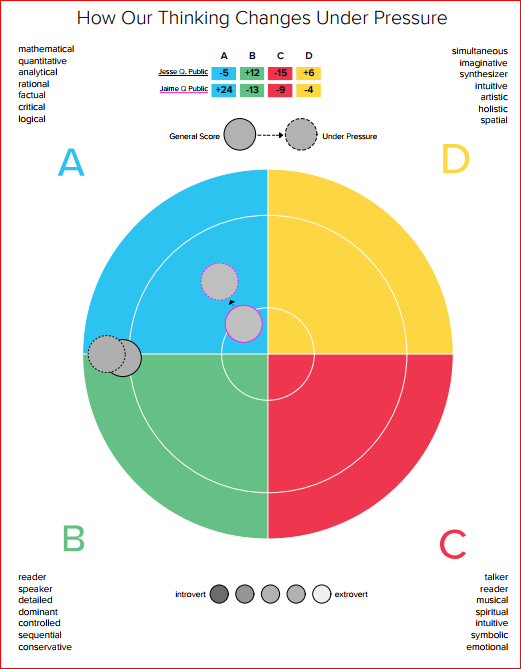
How Our Thinking Changes Under Pressure This report quickly shows Thinkers how their thinking preferences may shift when they find themselves in “Under Pressure” situations. Recognizing those possible shifts can encourage pairs to be mindful of how those pressured situations impact each person and their thinking preferences. |
 |
Twenty Questions: Now on Two Easy to Read Pages
The Twenty Questions Reporting has now been separated into two sections of 10 questions. This approach makes the reporting much easier to read. The Responses for each Thinker are color coded for quick and easy comparison, and where both Thinkers have the same reaction, that response is very quickly recognized and designated as "both".

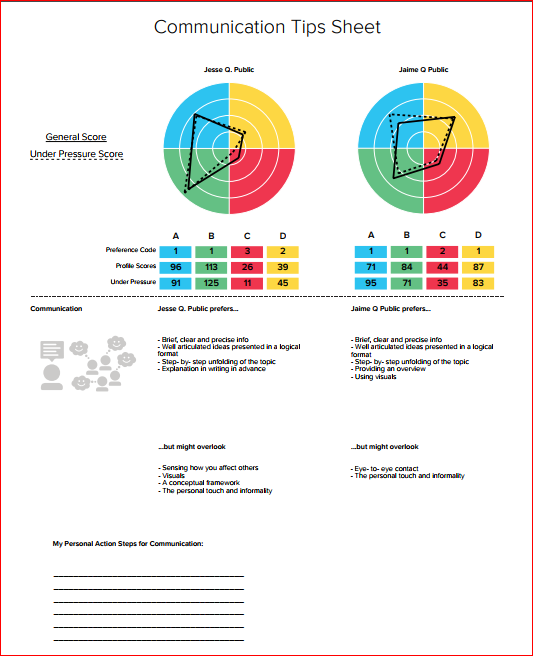
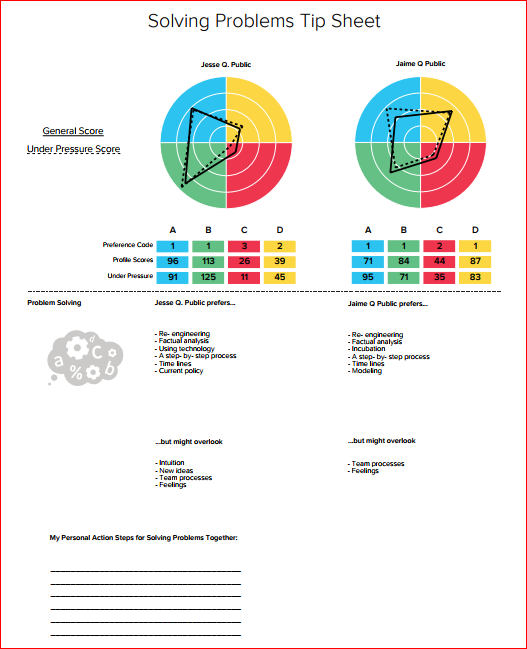
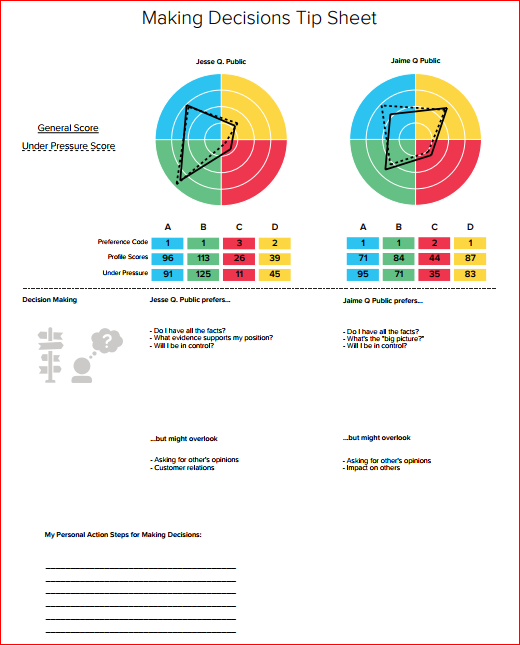
Tip Sheets: Problem Solving / Communication / Decision Making
Let’s take action! Each Thinker’s preferences impact how they solve problems, make decisions, and how they communicate. Comparing how Thinkers prefer to engage in these activities and where they may overlook opportunities can be very meaningful applications. There’s even a spot for jotting down action items each Thinker can commit to.
Was this article helpful?
Articles in this section
- Accessing and Interpreting the HBDI® Reports (Samples Included)
- HBDI REPORT: Preference Map with Initials AND with the Under Pressure Scores
- I Need My Code Unlock | Unlock My Results
- The HBDI® Individual Report: Adolescent Education, Educational Focus, Occupation and Hobbies:
- NEW HBDI® Twenty Questions Reports for the Team and Pair Report Packets
- I Have a "Large" Group of HBDI® Assessments, Can I Run Reports?
- The HBDI® Linear Continuum
- How to Print HBDI® Individual Reports
- Downloading Reports Using Chrome Yields an Error
- Downloading Reports Using Chrome Yields an Error
Add comment
Please sign in to leave a comment.